In Part 1 we explained when dedicated servers make sense instead of VPS or VDS, and what to consider when sizing hardware based on your target workload. We also connected these decisions to our server configurator. This part builds on that by comparing our three dedicated server tiers side by side, what each platform is designed for, where it reaches its limits, and the trade-offs between the tiers.
For readers who want a consolidated analysis of the entire STW system portfolio price points, relative performance, and cost efficiency, see the final chapter of this article, which summarizes the data in a table and four visual charts.
We standardized on AMD for a mix of technical and operational reasons. AMD’s server platforms deliver strong performance across both lightly threaded and highly parallel workloads, and over the last several generations have also been at the top end of x86 core count options. They also offer a long, stable socket lifecycle. That longevity matters in practice: at least two CPU generations can run on the same platform, so we do not need to introduce a new hardware design each time AMD releases a new EPYC generation.
Combined with a broad but coherent range of CPU models, plus strong memory and I/O throughput, this lets us cover most real-world workloads using a small set of proven systems. Standardizing on fewer platforms streamlines server sales, deployment, and maintenance, which helps us deliver tried-and-tested systems at competitive pricing.
If you want the quick takeaway, here is how to read our three dedicated server tiers:
- The entry-level 1P platform (Ryzen 9000 series, socket AM5) is about very high clock speeds and strong performance per core at a low system cost, with limited platform headroom for cores, memory bandwidth and capacity, and PCIe and storage expansion.
- The mid-level 1P platform (EPYC 7000 “Milan” series, socket SP3) is the consolidation workhorse, built for stability under sustained mixed load, with more headroom than AM5. It is typically not the fastest choice for latency-bound workloads, and as a previous generation platform it offers less long-term scaling headroom.
- The performance 1P platform (EPYC 9000 series, socket SP5) is the headroom tier: it offers higher core counts, higher memory and I/O bandwidth, and more long-term scaling headroom. It introduces both standard-core and dense-core EPYC choices, depending on whether your priority is per-thread speed or parallel throughput. It is also the highest-cost tier, and easiest to overbuild if your workload cannot use the added parallelism or bandwidth.
Entry tier – AMD Ryzen 9000 CPU series
Reference specification: ASRock Rack EPYC4000D4U system board, 16 “Granite Ridge” cores, 4.3 GHz base / 5.7 GHz boost, 32 GB unbuffered DDR5 RAM, 2×960 GB NVMe in RAID. The board name reflects ASRock Rack’s support for EPYC 4000-series CPUs on the same AM5 platform; our configuration uses Ryzen 9000 series.
| 5th gen AMD desktop CPU, socket AM5 | Cores / Threads | Base clock | Boost Clock | L3 Cache | TDP | 5th Gen AMD server CPU “analog”, socket AM5 | Cores / Threads | Base clock (GHz) | Boost Clock (GHz) | L3 Cache | TDP | Ryzen – EPYC CPU Model differences | |
| Ryzen 7 9700X | 8 / 16 | 3.8 GHz | ~5.5 GHz | 32 MB | 65 W | EPYC 4345P | 8 / 16 | 3.8 GHz | ~5.5 GHz | 32 MB | 65W | Complete Parity | |
| Ryzen 9 9900X | 12 / 24 | 4.4 GHz | ~5.6 GHz | 64 MB | 120 W | EPYC 4465P | 12 / 24 | 3.4 GHz | ~5.4 GHz | 64 MB | 65W | TDP / clock range | |
| Ryzen 9 9950X | 16 / 32 | 4.3 GHz | ~5.7 GHz | 64 MB | 170 W | EPYC 4565P | 16 / 32 | 4.3 GHz | ~5.7 GHz | 64 MB | 170W | Complete Parity | |
Reference configuration price: from 1 873 NOK/month.*
This is the single-thread performance tier: exceptional per-core speed for demanding, latency-sensitive applications such as game servers, high-traffic web and application hosting, or a small number of high-performance VMs where per-core speed matters more than density. The trade-off is limited core count, memory, and I/O expansion: the platform has four DIMM slots and a modest PCIe budget for storage, networking, and accelerators.
This pattern is typical for single-socket boards in this class, where AMD’s segmentation keeps complexity and cost down but results in limited scalability, making it a poor choice for true server workload consolidation.
As of early 2026, unbuffered DIMM pricing and availability are the main external factors affecting the entry tier’s value. If supply tightens, we may restrict memory options, adjust pricing, or provision on longer lead times.
Mid tier – AMD EPYC 7000 CPU series
Reference specification: Supermicro H12SSL-NT system board, AMD EPYC 7443 (24-core “Milan”), 2.85 GHz base / 4.0 GHz boost, 64 GB registered DDR4-3200 RAM, 2×960 GB NVMe.
Reference configuration price: from 2 819 NOK/month.*
This is the “run many things well” tier. Compared with the Ryzen system, you give up some peak per-core clock speed, but you gain a platform built to stay stable under sustained, concurrent load, several services side by side, multiple VMs, or background-heavy workloads that rarely go idle.
This socket SP3-based platform previously was our performance tier, and it is still a capable, stable base for production workloads. The difference today is that our performance tier has moved to socket SP5 equipped with faster memory and I/O, which raises platform bandwidth and expansion headroom for heavier consolidation.
In practice, this tier fits general-purpose production use: multi-service web and application hosting, CI/CD runners and build servers, mid-size databases, and internal platforms where you want headroom for growth without going straight to the high end. It is also a solid base for Proxmox hosts and storage-heavy setups, where having many threads and predictable throughput matters more than chasing the highest single-thread score.
This tier offers from 8 to 64 cores, which lets you prioritize either per-thread performance (16-24 core CPUs) or thread count (32-64 core CPUs), depending on how your workload scales. If you need a larger memory footprint than the standard options shown, or a different storage layout than the standard options, tell us and we will size a custom configuration.
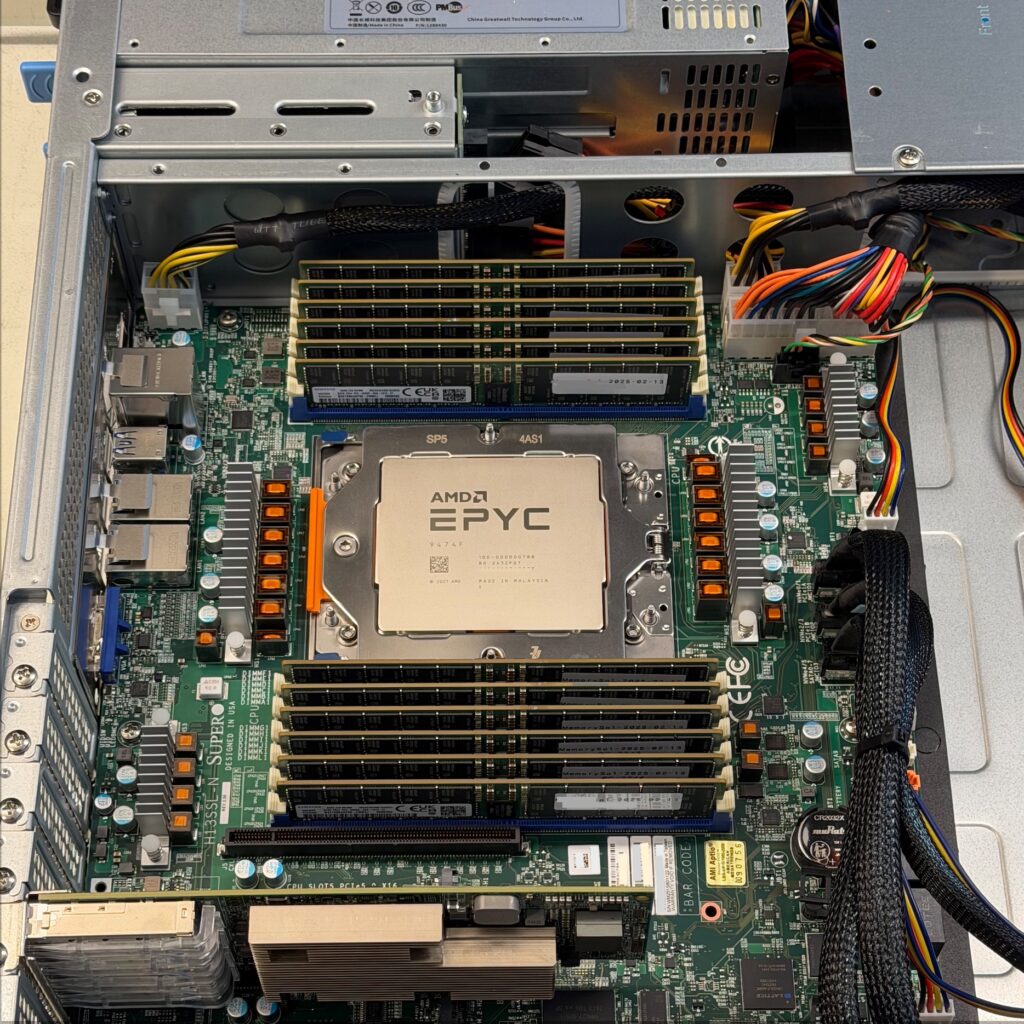
Performance tier – AMD EPYC 9000 series
Reference specification: Supermicro H13SSL-NT system board, 24-core AMD EPYC 9274F, 256 GB registered DDR5 RAM, 2×960 GB NVMe. Note: some high-density SKUs may use an alternative board.
Reference configuration price: from 5 963 NOK/month.*
This tier is built on the current-generation EPYC platform, designed for faster time to result and higher sustained throughput in consolidated, multi-workload environments. It is the natural choice for higher-density virtualization hosts, busy multi-service environments, and CPU-bound workloads where queue time and worst-case response times matter.
The EPYC 9000 platform also spans a much wider CPU range, from lower core-count, frequency-focused models to dense-core designs up to 196 cores, depending on whether your priority is per-thread speed or parallel throughput.
We can leverage published SPEC CPU2017 integer results, an industry-standard server benchmark, to compare relative performance of 24-core CPUs across three server processor generations using documented, validated, and fully disclosed test runs:
| SPEC CPU2017 Integer (base) | When it matters | EPYC 7443 (24-core ”Milan”, middle tier) | EPYC 9274F (24-core “Genoa”, perf. tier) | EPYC 9275F (24-core “Turin”, perf. tier) | Speedup – 9274F vs 7443 / 9275F vs 7443 / 9275F vs 9274F |
| Rate (throughput performance) | Parallel throughput when running many copies at once, typically the more relevant view for VM hosts and consolidated servers. | 215 | 316 | 415 | 1.47× / 1.93× / 1.31× |
| Speed (single-copy performance) | Single-copy completion time, often used as a proxy for per-core relative performance and per-instance responsiveness. | 13.5 | 15.9 | 20.8 | 1.18× / 1.54× / 1.31× |
Sources (SPEC CPU2017 Integer, base):
- EPYC 7443 Rate: https://www.spec.org/cpu2017/results/res2021q3/cpu2017-20210719-28274.html
- EPYC 7443 Speed: https://www.spec.org/cpu2017/results/res2021q3/cpu2017-20210913-29236.html
- EPYC 9274F Rate: https://www.spec.org/cpu2017/results/res2024q1/cpu2017-20231218-40414.html
- EPYC 9274F Speed: https://www.spec.org/cpu2017/results/res2024q1/cpu2017-20240212-41448.html
- EPYC 9275F Rate: https://www.spec.org/cpu2017/results/res2025q4/cpu2017-20251117-50342.html
- EPYC 9275F Speed: https://www.spec.org/cpu2017/results/res2025q4/cpu2017-20251117-50343.html
We refer to SPEC CPU benchmarks because they are one of the few widely used, standardized CPU benchmarks in the server industry with published run rules and a repeatable methodology. Published results include disclosures of the system configuration and compiler settings, which makes them reasonably comparable across vendors and platforms. Like any benchmark, SPEC is not a perfect proxy for every workload, but it provides a consistent baseline for understanding relative CPU performance when real application measurements are not available.
SPEC “speed” is a single-copy metric, it compares how long a system takes to complete one instance of each workload. SPEC “rate” is a throughput metric, it measures how much work a system completes when running multiple copies in parallel.
To simplify matters further, it is often reasonable to treat SPEC “speed” as a proxy for per-core relative performance, in the sense of how much work one core can get through on a typical compute-bound task, and SPEC “rate” as a proxy for multi-core throughput, in the sense of how well the system scales when running many jobs in parallel. This is a simplification, not a definition, but it is usually a useful way to compare server classes when you do not have application-specific benchmarks.
To find and compare additional SPEC results, use the SPEC CPU 2017 search form at https://www.spec.org/cgi-bin/osgresults?conf=cpu2017. SPEC CPU 2017 is the current version of SPEC’s widely used server CPU benchmark suite, and the one referenced here. In the “Available Configurations” dropdown, pick the relevant CPU 2017 category (for example, SPECspeed2017_int for single-copy performance or SPECrate2017_int for throughput), enter a server-class CPU model name in the “Processor” filter, then execute the search and sort the returned table by the score columns to compare CPUs side by side.
Expect a range of scores for the same CPU, because results are published on complete systems from different server vendors. The numbers will vary with platform details (single-socket vs dual-socket configurations, motherboard and BIOS defaults, memory population and speeds, power limits) and with compiler and tuning choices, even though they usually cluster fairly close for properly configured runs.
For a quick, practical comparison, focus on 1-socket (1P) systems and use the best Base result you can find for each CPU in the category you care about. In most cases, the top Base scores are close enough across submitted systems to give a clear, sortable picture of how models and generations compare, without overthinking vendor-specific platform differences.
Even on a like-for-like 24-core comparison, the uplift can be substantial and it gives you more flexibility in how you size the system. In some cases you can hit the same per-instance performance target with fewer, faster cores to reduce system cost or improve licensing efficiency, while in others you still need core count for VM density or parallel throughput. The practical point is that the newer platform gives you more freedom in CPU sizing, how you balance core count, clock speed, and throughput for your workload.
The advantage is not limited to CPU performance. EPYC 9000 also raises the platform ceiling with 12-channel DDR5 and a higher overall I/O envelope. In our current reference configurations we use PCIe Gen 4 NVMe across tiers, but the underlying platform still provides more bandwidth headroom for dense virtualization, larger in-memory working sets, and higher sustained storage and network load.
When comparing the mid tier and performance tier, think in performance per NOK and time to result. EPYC 9000 may cost more, but the combination of per-core performance and platform headroom can justify it for demanding consolidation and higher-density use. At the other end of the range, Ryzen remains a strong value when the workload is lightly threaded and not memory or I/O bound.
Summary: STW servers by performance and cost efficiency
As a final step, we summarize the relative performance and price of our three tiers in the table below, and then visualize the same data in four small charts. To keep the comparison fair, we equalized the reference configurations across the systems using 128 GB total memory and 2×960 GB NVMe storage. We start with published SPEC CPU2017 integer scores for comparable server-class CPUs, and combine them with reference monthly pricing from our configurator. The result is a compact view of both absolute performance and performance per NOK.
| Tier | Processor models, available for order from STW (as of Feb’26) | Platform Code | CPU Generation | Socket | Cores | Base Clock (GHz) | Max Boost Clock (GHz) | Memory Channels | Memory Type | 1 DPC Max Speed (MT/s) | 1 DPC Max BW (GB/s) | 2 DPC Max Speed (MT/s)* | 2 DPC Max BW (GB/s)* | SPECspeed2017_int perf (Median Score) | SPECspeed2017_int perf/core (Median Score) | SPECspeed2017_int perf/core (Normalized) | SPECrate2017_int perf/CPU (Median Score) | SPECrate2017_int perf/CPU (Normalized) | Rent / Month in NOK (all configurations use 128GB RAM, 2 x 960GB NVMe) | System Price (Base with 128GB, 2 x 960GB NVMe) / SPECrate 2017_Integer | System Price (Base with 128GB, 2 x 960GB NVMe) / SPECspeed2017_Integer |
| Entry | Ryzen 9700x 3.80 GHz 8 Core | 8C Ryzen 9700x (Granite Ridge) | Zen 5 | AM5 | 8 | 3.8 | 5.5 | 2 | DDR5 | 5600 | 89.6 | 5200 | 83.2 | 21.7 | 2.71 | 4.84 | 119 | 0.55 | 2,601.00 kr | 21.9 | 119.9 |
| Ryzen 9900x 4.40 GHz 12 Core | 12C Ryzen 9900x (Granite Ridge) | Zen 5 | AM5 | 12 | 4.4 | 5.6 | 2 | DDR5 | 5600 | 89.6 | 5200 | 83.2 | NA | NA | NA | NA | NA | 2,682.00 kr | NA | NA | |
| Ryzen 9950x 4.30 GHz 16 Core | 16C Ryzen 9950x (Granite Ridge) | Zen 5 | AM5 | 16 | 4.3 | 5.7 | 2 | DDR5 | 5600 | 89.6 | 5200 | 83.2 | 22.6 | 1.41 | 2.52 | 205 | 0.95 | 2,841.00 kr | 13.9 | 125.7 | |
| Mid | AMD Epyc 7252 3.10 GHz 8 Core | 8C EPYC 7252 (Rome) | Zen 2 | SP3 | 8 | 3.1 | 3.2 | 8 | DDR4 | 3200 | 204.8 | 2666–2933 | 170.6–187.7 | 8.1 | 1.01 | 1.8 | 60.3 | 0.28 | 2,902.00 kr | 48.1 | 358.3 |
| AMD Epyc 7262 3.20 GHz 8 Core | 8C EPYC 7262 (Rome) | Zen 2 | SP3 | 8 | 3.2 | 3.4 | 8 | DDR4 | 3200 | 204.8 | 2666–2933 | 170.6–187.7 | 8.5 | 1.06 | 1.89 | 65.6 | 0.31 | 2,693.00 kr | 41.1 | 316.8 | |
| AMD Epyc 7302P 3.00 GHz 16 Core | 16C EPYC 7302P (Rome) | Zen 2 | SP3 | 16 | 3 | 3.3 | 8 | DDR4 | 3200 | 204.8 | 2666–2933 | 170.6–187.7 | 8.6 | 0.54 | 0.96 | 120 | 0.56 | 3,321.00 kr | 27.7 | 386.2 | |
| AMD Epyc 7402P 2.80 GHz 24 Core | 24C EPYC 7402P (Rome) | Zen 2 | SP3 | 24 | 2.8 | 3.35 | 8 | DDR4 | 3200 | 204.8 | 2666–2933 | 170.6–187.7 | 8.6 | 0.36 | 0.64 | 170 | 0.79 | 3,510.00 kr | 20.6 | 408.1 | |
| AMD Epyc 7443 2.85 GHz 24 Core | 24C EPYC 7443 (Milan) | Zen 3 | SP3 | 24 | 2.85 | 4 | 8 | DDR4 | 3200 | 204.8 | 2666–2933 | 170.6–187.7 | 13.5 | 0.56 | 1 | 215 | 1 | 3,544.00 kr | 16.5 | 262.5 | |
| AMD Epyc 7713P 2.GHz 64 Core | 64C EPYC 7713P (Milan) | Zen 3 | SP3 | 64 | 2 | 3.7 | 8 | DDR4 | 3200 | 204.8 | 2666–2933 | 170.6–187.7 | 12.4 | 0.19 | 0.34 | 378 | 1.76 | 4,000.00 kr | 10.6 | 322.6 | |
| AMD Epyc 7763 2.45 GHz 64 Core | 64C EPYC 7763 (Milan) | Zen 3 | SP3 | 64 | 2.45 | 3.5 | 8 | DDR4 | 3200 | 204.8 | 2666–2933 | 170.6–187.7 | 11.9 | 0.19 | 0.34 | 412 | 1.92 | 4,166.00 kr | 10.1 | 350.1 | |
| Performance | Epyc 9274F – 24 Core 4.05 Ghz | 24C EPYC 9274F (Genoa) | Zen 4 | SP5 | 24 | 4.05 | 4.3 | 12 | DDR5 | 4800 | 460.8 | 4400 | 422.4 | 15.9 | 0.66 | 1.18 | 316 | 1.47 | 4,650.00 kr | 14.7 | 292.5 |
| Epyc 9474F – 48 Core 3.6 GHz | 48C EPYC 9474F (Genoa) | Zen 4 | SP5 | 48 | 3.6 | 4.1 | 12 | DDR5 | 4800 | 460.8 | 4400 | 422.4 | 15.2 | 0.32 | 0.57 | 554 | 2.58 | 5,293.00 kr | 9.6 | 348.2 | |
| Epyc 9275F – 24 core 4.1 GHz | 24C EPYC 9275F (Turin) | Zen 5 | SP5 | 24 | 4.1 | 4.3 | 12 | DDR5 | 5600 | 537.6 | 4400 | 422.4 | 20.2 | 0.84 | 1.5 | 389 | 1.81 | 6,166.00 kr | 15.9 | 305.2 | |
| Epyc 9375F – 32 core 3.8 GHz | 32C EPYC 9375F (Turin) | Zen 5 | SP5 | 32 | 3.8 | 4 | 12 | DDR5 | 5600 | 537.6 | 4400 | 422.4 | 20.2 | 0.63 | 1.13 | 505 | 2.35 | 6,398.00 kr | 12.7 | 316.7 | |
| Epyc 9754 – 128 Core 2.25 GHz | 128C EPYC 9754 (Bergamo) | Zen 4c | SP5 | 128 | 2.25 | 3.8 | 12 | DDR5 | 4800 | 460.8 | 4400 | 422.4 | 11.3 | 0.09 | 0.16 | 941 | 4.38 | 7,042.00 kr | 7.5 | 623.2 | |
| Epyc 9555 – 64 Core 3.2 GHz | 64C EPYC 9555 (Turin Dense) | Zen 5c | SP5 | 64 | 3.2 | ~3.7 | 12 | DDR5 | 5600 | 537.6 | 4800–5200 | 460.8–499.2 | 18.9 | 0.3 | 0.54 | 812.5 | 3.78 | 7,251.00 kr | 8.9 | 383.7 | |
| Epyc 9655 – 96 Core 2.6 GHz | 96C EPYC 9655 (Turin Dense) | Zen 5c | SP5 | 96 | 2.6 | ~3.7 | 12 | DDR5 | 5600 | 537.6 | 4800–5200 | 460.8–499.2 | 19.3 | 0.2 | 0.36 | 1020 | 4.74 | 7,422.00 kr | 7.3 | 384.6 | |
| Epyc 9965 – 192 Core 2.25 GHz | 192C EPYC 9965 (Turin Dense) | Zen 5c | SP5 | 192 | 2.25 | ~3.7 | 12 | DDR5 | 5600 | 537.6 | 4800–5200 | 460.8–499.2 | 16.1 | 0.08 | 0.14 | 1405 | 6.53 | 8,271.00 kr | 5.9 | 513.7 |
Table 1. STW dedicated server tiers, relative performance and cost efficiency (SPEC CPU2017 Integer)
* Mid- and Performance tier servers, based on the SuperMicro H12SSL-NT and H13SSL-NT system boards, are 1 DPC memory confirurations ( Milan system: 8 DIMM slots; Genoa/Turin system: 12 DIMM slots in total )
The 2 DPC configurations are available with the Entry tier servers (a total of 4 DIMM slots) and the Pertmance tier, when based on the Gigabyte MZ33-AR1-rev-3x board (with a total of 24 DIMM slots).
All systems are single socket servers (1 CPU only).
Memory speeds shown are the peak speeds.
The median perf/core or perf/CPU shown by the cpuperfcomp tool is derived from multiple real-world SPEC submissions and statistical aggregation.
Therefore the median may be slightly lower than the single-system SPECspeed2017_base or SPECrate2017_base value reported on the linked SPEC result page.
Median perf/core and perf/CPU values are generated using corresponding official SPEC benchmark result pages for the similar class systems equipped with identical CPU model.
Median score represents typical production deployments.
All performance figures are obtained using SPEC/OSG Result Search Engine (https://www.spec.org/cpu2017/results/).
This table is provided for reference purposes only and does not represent the measured performance of actual ServeTheWorld server configurations.
SPEC CPU scores are unavailable for Ryzen 7 9700X, Ryzen 9 9900X, and Ryzen 9 9950X. To establish their relative performance, we relied on the scores of identical AMD EPYC 4005 Series (Zen 5) server processors.
Legal disclaimer: SPEC and the “performance chart” SPEC logo are registered trademarks of the Standard Performance Evaluation Corporation.
This comparison focuses on hardware price and performance only. Software licensing can change the economics and should be accounted for separately. For Windows Server in particular, our SPLA-based licensing makes lower core counts more attractive, since the minimum licensed core count starts at 8 cores rather than 16. In that context, the 8-core options in the table can be worth a closer look: an 8-core EPYC option in the mid tier can be a cost-efficient baseline when you want the platform features of EPYC at the lowest licensed core count, while an 8-core, high-frequency Ryzen option can be a strong fit when per-thread performance is the priority.
Across all four charts, the most attractive combinations sit in the bottom-right corner: more performance, or stronger performance per NOK, at a lower cost.

Visualization 1: System performance vs monthly cost (throughput)
What it shows: Monthly system price (NOK) versus multi-threaded throughput (SPECrate).
How to read it: Use this view when you care about parallel work, VM hosts, consolidation, batch processing, or busy multi-tenant services. Systems further to the right deliver more total throughput. The vertical placement reflects monthly price.
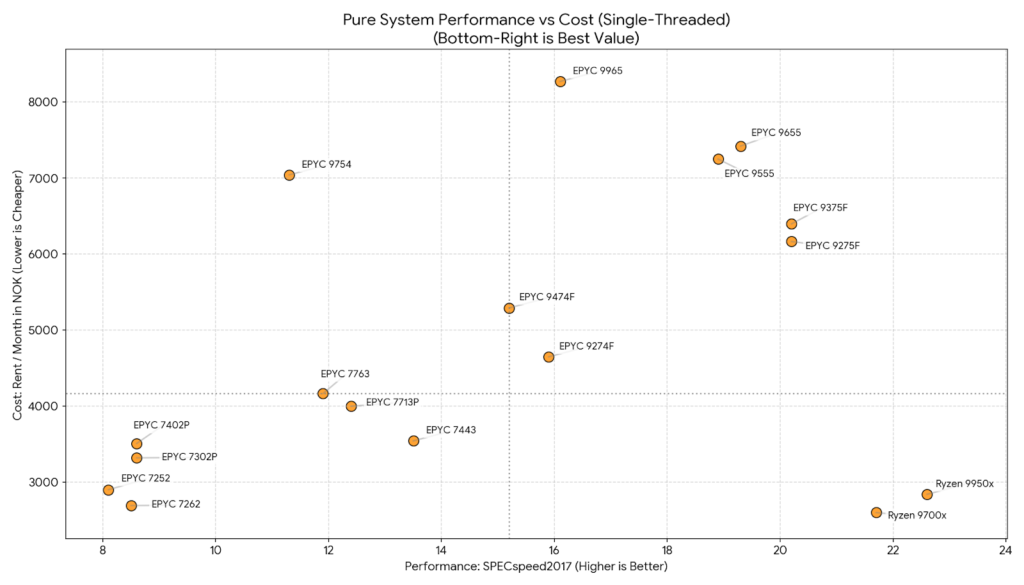
Visualization 2: System performance vs monthly cost (single-copy)
What it shows: Monthly system price (NOK) versus single-copy performance (SPECspeed).
How to read it: Use this view for latency-sensitive or lightly threaded workloads, where additional cores bring limited benefit and per-core speed matters more. Systems further to the right complete a single workload instance faster. The vertical placement reflects monthly price.

Visualization 3: Performance per NOK (multi-threaded throughput)
What it shows: Cost per unit of multi-threaded throughput (NOK per SPECrate point).
How to read it: This is the performance-per-NOK view for consolidated workloads. Higher-end EPYC platforms often have a higher monthly rent, but cost per throughput point generally improves as core count and platform headroom increase. Bottom-right is where throughput per krone is strongest.

Visualization 4: Performance per NOK (single-copy)
What it shows: Cost per unit of single-copy performance (NOK per SPECspeed point).
How to read it: This is the performance-per-krone view for per-core speed. It highlights where high clock speeds translate into practical performance without an outsized price premium, while keeping in mind that entry platforms remain limited in memory capacity, bandwidth, and expansion headroom.
What’s next
In the upcoming final article in this series, we move from platform choice to ServeTheWorld’s policies and operations, including how we build and validate dedicated servers, typical provisioning lead times, how upgrades work, and our support model and SLA.
* Starting price points as of March 1, 2026. Prices are for reference and may change without notice.
Alexey Nechuyatov
Strategic development, ServeTheWorld